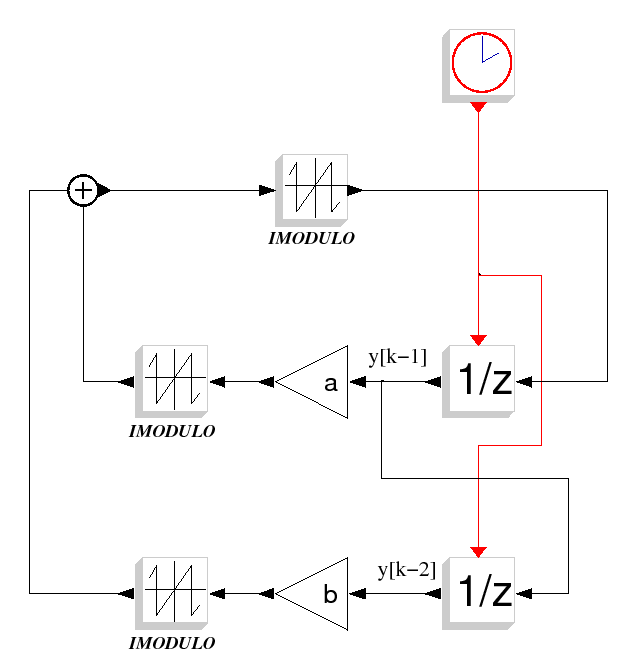
Script de simulation Scilab
fr -
eng
Densité de probabilité de sortie d'un filtre RII du deuxième ordre
lin_chua_sim.cos
function [x,y]=mhistplot(n,data)
  p=size(data,'*')
  data=data(:)

  if size(n,'*')==1 then
     x = linspace(min(data), max(data), n+1)';
  else
     x=n(:)
  end,
  n=prod(size(x));

  [ind , y] = dsearch(data, x);

  y=[y;y(n-1)];
  nx=maxi(min(15,prod(size(x))-1),1);
endfunction

//set("figure_style","old")
load SCI/macros/scicos/lib
exec(loadpallibs,-1)
%tcur=0;
%cpr=list();
alreadyran=%f;
needstart=%t;
needcompile=4;
%state0=list();
prot=funcprot();funcprot(0);
deff('disablemenus()',' ')
deff('enablemenus()',' ')
funcprot(prot)

load(MODNUM+'/simu/lin_chua_sim/lin_chua_sim.cos')
//Tests for scicos version
ierr = execstr('current_version=get_scicos_version()','errcatch')
if ierr==0 then //scilab > 4.1x
 //check version
 if type(scs_m)==17 then
    if find(getfield(1,scs_m)=='version')<>[] then
       if scs_m.version<>'' then
         scicos_ver=scs_m.version
       end
    end
 end
 if current_version<>scicos_ver then
    scs_m=do_version(scs_m,scicos_ver)
 end
 %scicos_debug_gr=%f;
else //scilab 3.0-4.1x
  set("figure_style","old")
end

context=scs_m.props("context");
execstr(context);

tolerances=scs_m.props.tol;
solver=tolerances(6);
scs_m.props.context(3)='Nbit=16';
ci=0.66:2e-3:0.68;
Nbsampl=1e4;
Nbsampl=5e3;
z=zeros(size(ci,2),Nbsampl);
for j=1:size(ci,2)
 scs_m.props.context(6)='ci='+string(ci(j));
 %scicos_context=struct();
 [%scicos_context,ierr]=script2var(scs_m.props.context,%scicos_context);
 [scs_m,%cpr,needcompile,ok]=do_eval(scs_m,%cpr);
 [%cpr,%state0_n,needcompile,alreadyran,ok]=do_update(%cpr,%state0,needcompile);
 %state0=%state0_n;
 %tcur=0;
 %cpr.state=%state0;
 tf=scs_m.props.tf;
 [state,t]=scicosim(%cpr.state,%tcur,tf,%cpr.sim,'start',tolerances);

 timer();
 y=[];
 %tcur=0;
 for i=1:Nbsampl

   tf=i*Te;
   [state,t]=scicosim(%cpr.state,%tcur,tf,%cpr.sim,'run',tolerances);
   %cpr.state=state;
   %tcur=tf;

   Nblock=3;
   y(1,i)=state("z")(%cpr.sim("zptr")(Nblock):%cpr.sim("zptr")(Nblock+1)-1);
   Nblock=6;
   y(2,i)=state("z")(%cpr.sim("zptr")(Nblock):%cpr.sim("zptr")(Nblock+1)-1);

 end
 z(j,:)=y(1,:);
 Tsim=timer();disp('Tsim:'+string(Tsim));

end

clear y;
k=200;
c=zeros(size(ci,2),k+1);
for j=1:size(ci,2)
 [a,b]=mhistplot(k,z(j,:));
 c(j,:)=matrix(b,1,k+1);
end
x=(1:size(ci,2))/size(ci,2);
y=(1:k+1)/k;
z=c/max(c);
set("figure_style","new");
scf(100);
plot3d(x,y,z,11,45,'X@Y@Z',[2,2,4])
lin_chua_sim.sce
IRCOM Group Alan Layec

