Scicos Diagram
fr - eng


Scattered diagram of base band QPSK transmission chain

\epsfig{file=qpsk_teb_diagr.eps,height=9cm}

Module


Contents

Description

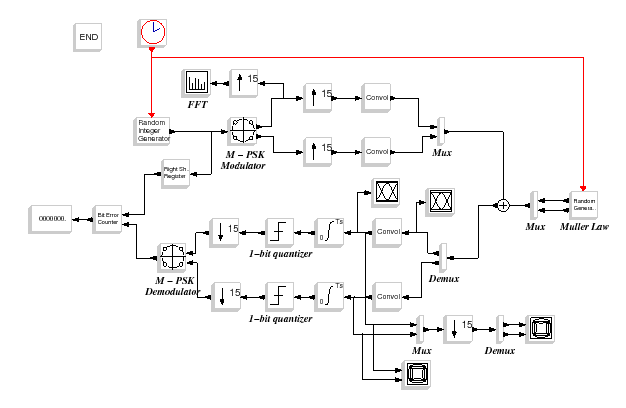
This diagram is a basic transmission chain composed by an emitter, a channel and a receiver. All is simulated in base band.

\begin{figure}\centering
\scalebox{0.6}{%
\input{qpsk_teb_eng.pstex_t}}
\end{figure}
Figure 1: Basic transmission chain

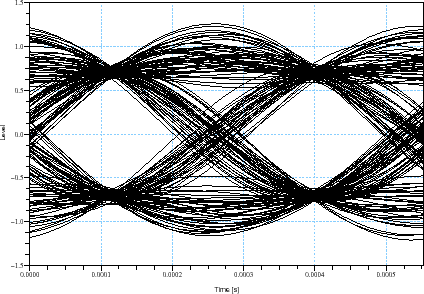
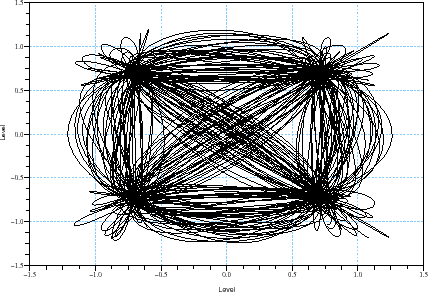
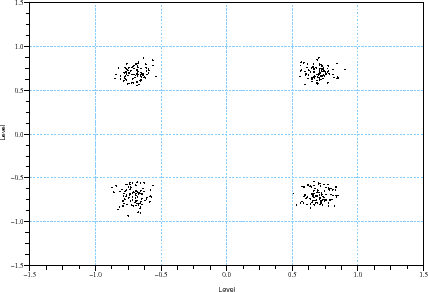
The used I/Q modulation is here a QPSK modulation. After being filtered in the emitter by a square root raised cosine (SRRC) filter, white gaussian noise is added to the symbol. The receiver use also a SRRC filter, and an integrator followed by a sign comparator are used before the I/Q demodulator. The bit error counter block compares emitted and received symbol.

Context


Te=0.1;
Nu=350;
Nech=15;
N=Nu*Nech;
Nbit=2;
nb_coef=127;  
r=0.35; 
fe=Nech; 
gain_em=1; 
gain_rec=1/Nech; 
pulse=filter_tap(1,nb_coef,fe,r,1);
Nb_vec=3;
nb_event=3;
Tfin=Te*Nb_vec*100;
sigma=0.2;
Scope Results

\begin{figure}\begin{center}
\epsfig{file=qpsk_teb_scope_1.eps,width=330.00pt}
\end{center}\end{figure}
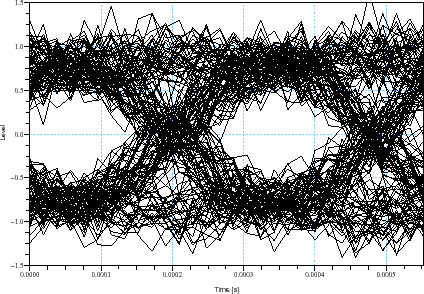
Figure : (a) Eye diagram after the AWGN channel.

\begin{figure}\begin{center}
\epsfig{file=qpsk_teb_scope_2.eps,width=330.00pt}
\end{center}\end{figure}
Figure : (b) Eye diagram after the filter.

\begin{figure}\begin{center}
\epsfig{file=qpsk_teb_scope_3.eps,width=330.00pt}
\end{center}\end{figure}
Figure : (c) Constellation after the filter.

\begin{figure}\begin{center}
\epsfig{file=qpsk_teb_scope_4.eps,width=330.00pt}
\end{center}\end{figure}
Figure : (d) Constellation at the sampling time.

\begin{figure}\begin{center}
\epsfig{file=qpsk_teb_scope_5.eps,width=330.00pt}
\end{center}\end{figure}
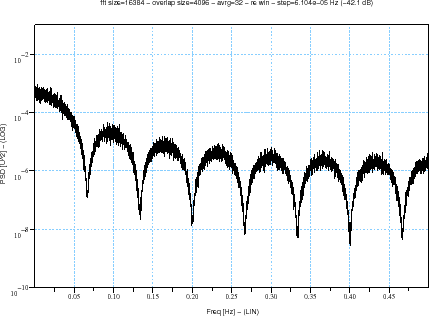
Figure : (e) Power Spectral Density of the emitted symbol.

Used blocks

Authors

A. Layec